Figure 3.
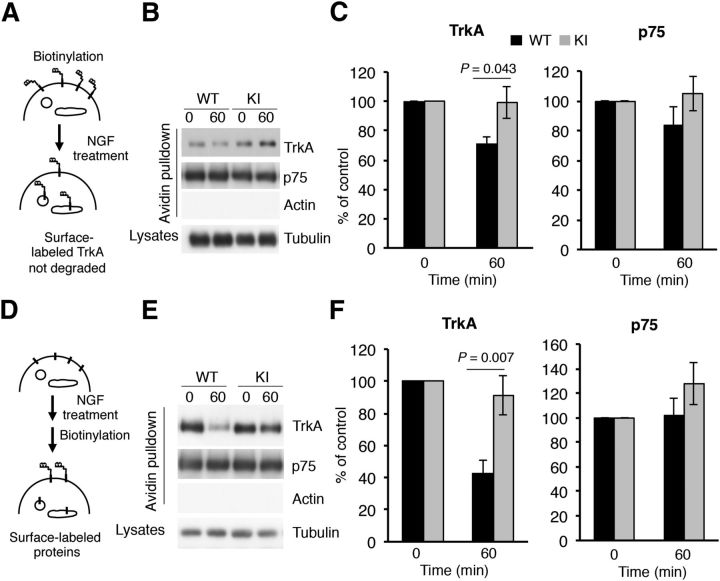
Decreased degradation and increased surface expression of TrkAP782S in response to NGF in DRG neurons. A, A receptor degradation assay was performed as depicted in the schematic diagram. Cultured DRG neurons from WT and KI mice were biotinylated to label surface proteins and were treated or not with NGF (50 ng/ml) for 60 min. Cells were processed as previously described (Yu et al., 2011). Subsequently, Western blot analyses with Trk, p75, and tubulin antibodies were performed. B, Representative Western blots are shown. Actin was used as a negative control for biotinylated proteins and tubulin as a loading control for lysates. C, Quantification of biotin-labeled TrkA and p75. Data are normalized to the amount of biotinylated TrkA and p75 in nontreated neurons. Results are presented as means ± SEM; p values were calculated using a two-tailed Student's t test (n = 3). Note that the levels of TrkAP782S at 60 min are similar to 0 min. D, A schematic diagram of the surface expression assay using the biotinylation procedure in response to NGF is shown. Mouse DRG neurons were treated or not with NGF (50 ng/ml) for 60 min, and then biotinylated as previously described (Yu et al., 2011). E, Representative Western blots are shown. Actin and tubulin were used as a negative controls for biotinylated proteins and as a loading control for lysates respectively. F, Quantification of surface TrkA and p75 upon NGF treatment. Data are presented as means ± SEM; p values were calculated using a two-tailed Student's t test (n = 4). Note that the surface levels of TrkAP782S at 60 min are similar to 0 min.

