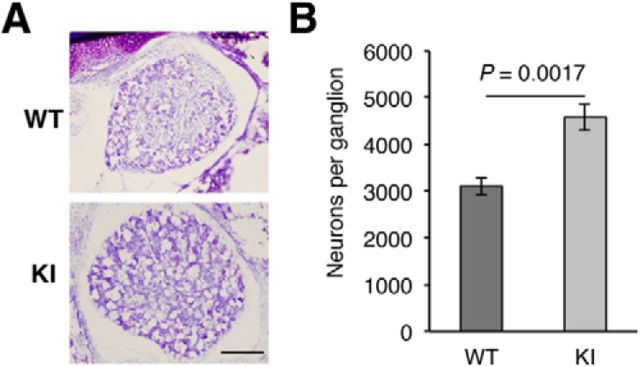
Figure 5.
Increased amount of DRG neurons in TrkAP782S mice. A, Nissl staining of L3 DRGs from P0 WT and KI mice. Representative pictures are shown. Scale bar, 100 μm. B, L3 DRGs from P0 KI mice have more neurons than sibling WT mice. Heterozygous females were mated with heterozygous males to obtain WT and KI mice. Results are presented as means ± SEM; p value was calculated using a two-tailed Student's t test (n = 4). Note the increase number of neurons in DRGs from KI mice.

