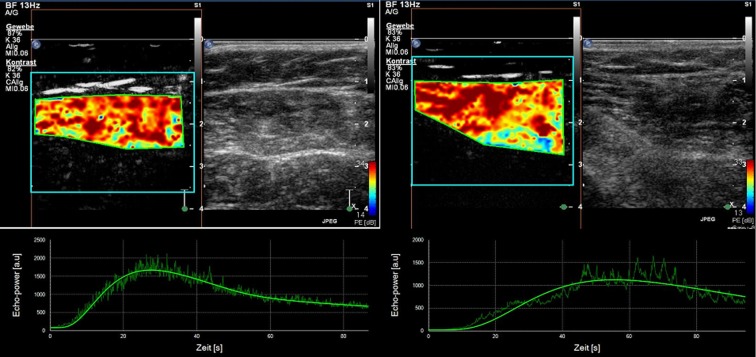
Figure 1.
Demonstrates skeletal muscle microperfusion on CEUS in a healthy volunteer (left part of the figure) and a patient with PAOD (right part of the figure). Time-intensity-curves of a region of interest (green square) within the skeletal muscle (gastrocnemius muscle) after bolus injection of the ultrasound contrast agent show a steeper slope in of wash-in-curve in combination with a shorter time-to-peak in the healthy volunteer.

