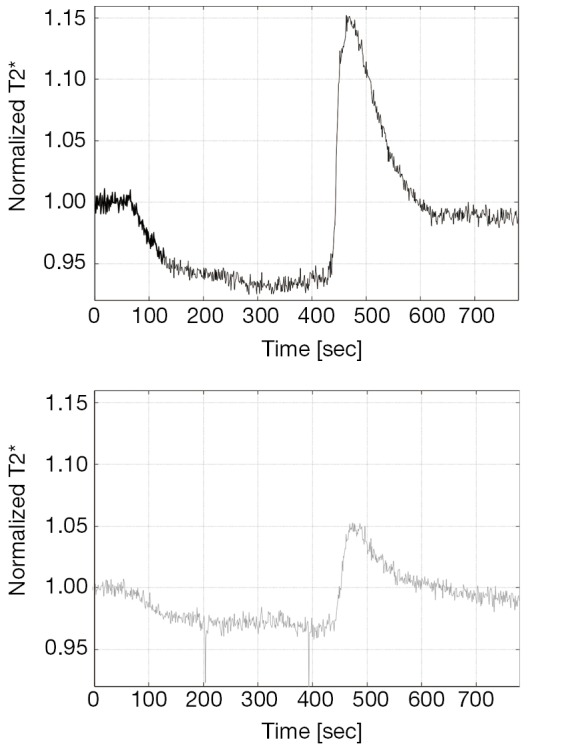
Figure 3.

Shows the T2* time course in a healthy 26-year-old male volunteer (upper part of the figure) and a 36-year-old female PAOD patient (lower part of the figure). The ischemia-hyperemia paradigm was applied. The T2* time course of the patient clearly differs in comparison to the healthy volunteer.
