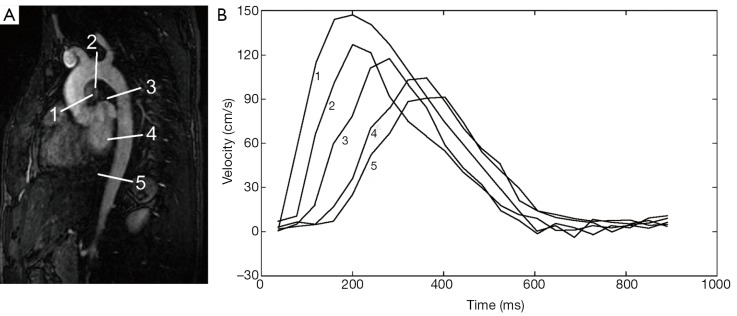
Figure 2.

This double oblique view of the thoracic aorta from a magnetic resonance angiogram (MRA) (A) is used to show five slices from which aortic mean velocity waveforms are derived from a flow sensitive MR imaging sequence. (B) From the five velocity waveforms a temporal shift can be appreciated as the aorta is traversed. This shift can be used to compute the pulse wave velocity either regionally, for example from any two of these waveforms, or globally, using all of the waveforms. Note that maximum velocity decreases progressively at downstream slice locations; maximum velocity decreases for a number of reasons, including resistance to flow and loss of flow volume from vessels branching from the aorta. The 5 flow waveforms in (B) are derived from the 5 slices in (A).
