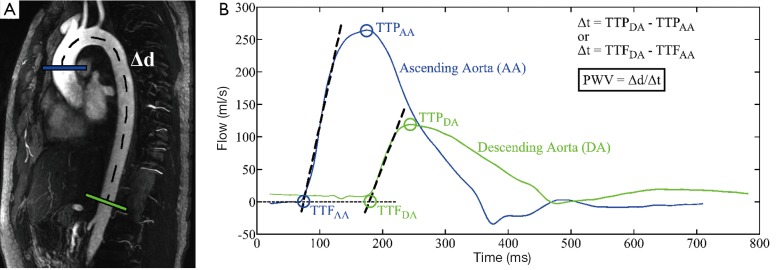
Figure 4.

Double oblique view of the thoracic aorta from an MR angiogram (A) with representative planes in the ascending and descending thoracic aorta. Flow waveforms (B) from the two planes are shown with the time-to-foot (TTF) and time-to-peak (TTP) algorithms. The best fit linear lines along the upstroke were used to identify the feet of the waveforms. Please note that the two planes shown in (A) are used to represent the two waveforms shown in (B).
