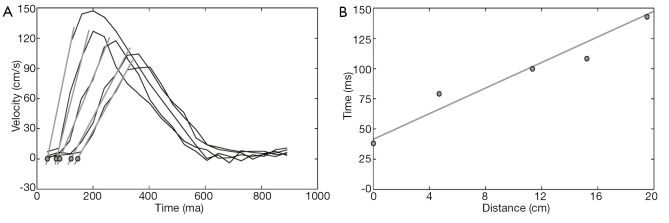
Figure 5.

Five velocity waveforms along the length of the aorta (A) each with a linear fit to the upstroke, shown in grey, as well as points identified as the foot of each waveform (grey circles with black borders). The time points associated with the feet of the waveform are plotted against the distance of separation between each plane used to extract the velocity information (B). The slope of a best fit line to the distance versus time plot provides time/distance. The inverse of this slope provides the pulse wave velocity measurement from this series of velocity waveforms.
