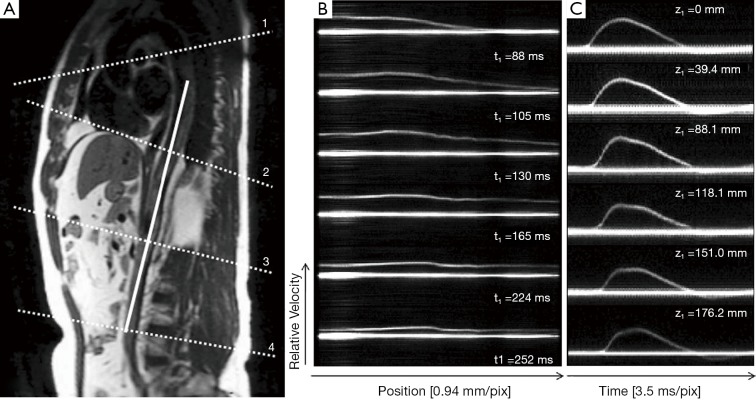
Figure 7.
An M-mode imaging. (A) A double oblique slice relative to the aorta shows a line through which a pencil beam was applied for M-mode imaging; (B) M-mode images at six different cardiac phases. The straight solid lines represent stationary objects within the pencil beam. The other lines represent blood velocity along the length of the pencil beam at a particular cardiac phase; (C) Reformatted M-mode images along the pencil beam show velocity waveforms over time for a given slice location. Figures reproduced with permission from Taviani et al. JMRI 2010 (49). In the original Taviani paper the four slices in (A) identify the slice prescriptions of 2D phase contrast slices. Pulse wave velocity values derived from these slices were compared to pulse wave values computed from M-mode imaging.

