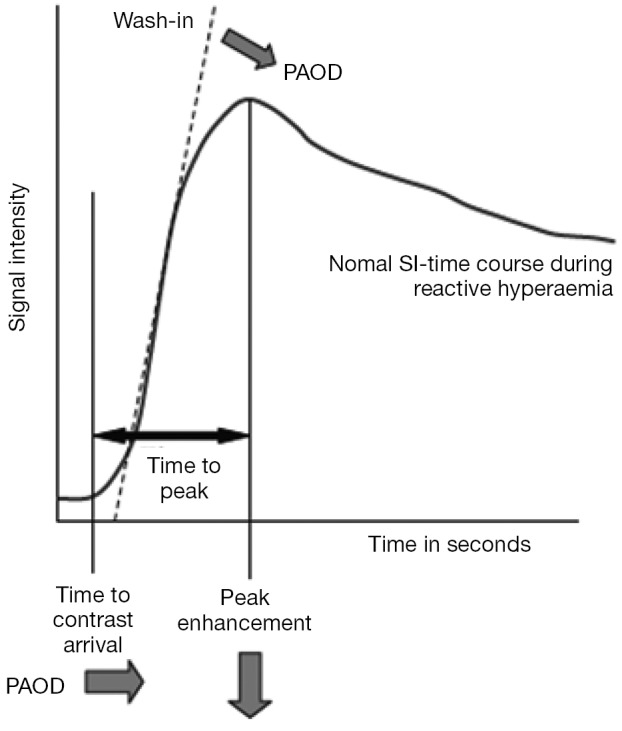
Figure 6.

Diagram of a TIC illustrating the CA dependent signal intensity of a tissue over time: the perfusion reserve of patients can be assessed by measuring the reactive hyperemia, following post occlusive or exercise protocols and comparing them with age-matched controls. In case of peripheral arterial occlusive disease (PAOD), the TIC displays a shallow increment (i.e., a delayed peak), a lower peak enhancement (arrows) and only a weak or absent washout after exercise, this indicates a limited vascular reserve. A rapid signal intensity increase followed by a narrow peak and consequent washout is evident of an adequate vascular reserve. This material is reproduced with permission of Springer from Weber et al., Quantitative evaluation of muscle perfusion with CEUS and with MR, European Radiology, 2007. TIC, time intensity curve; CA, contrast agent.
