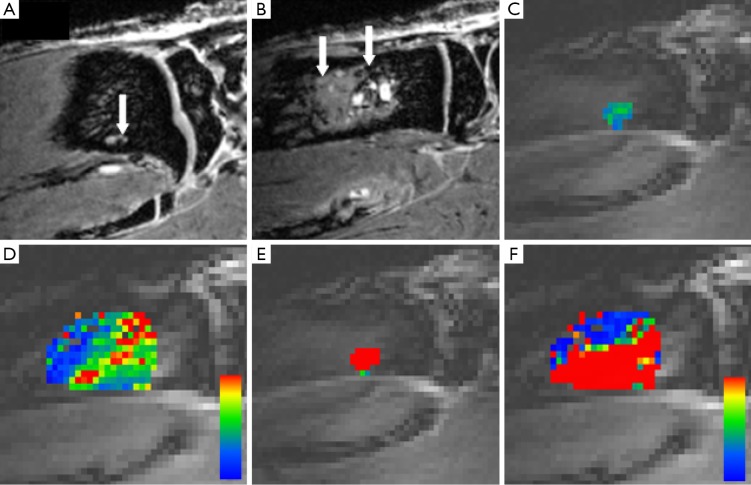
Figure 7.
Comparison of treated experimental breast cancer bone metastases-bearing rats at day 20 after tumor cell injection; T1-weighted MRI after contrast agent application (A), DCE-MRI-derived color coded maps for amplitude A (C) and exchange rate constant keρ (E) with sham-treated rats; T1-weighted MRI after contrast agent application (B), DCE-MRI-derived color-coded maps for amplitude A (D) and exchange rate constant keρ (F). Arrows point to soft tissue parts of bone metastases. DCE-MRI color code; red color indicates higher values and blue color depicts lower values for amplitude A (D) and exchange rate constant keρ (F). DCE-MRI, dynamic contrast-enhanced magnetic resonance imaging.

