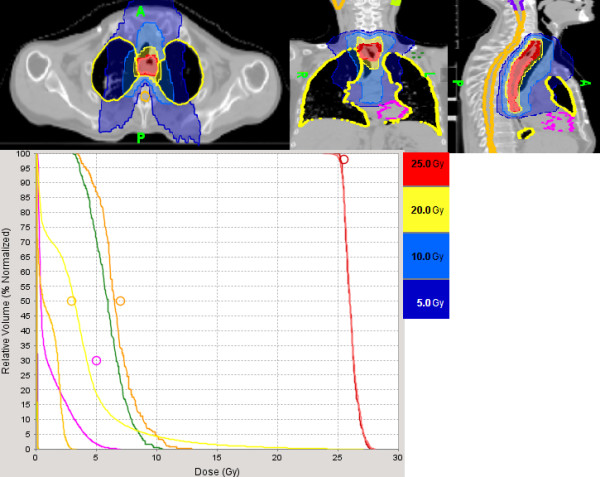
Figure 2.

Illustration of the dose-volume histogram of the tumor boost in the same patient on the planning CT repeated at 40 Gy. The gross tumor had decreased in size significantly and was boosted to 25 Gy at 1.25 Gy twice a day to decrease the risk of complications because of the tumor close proximity to the trachea and blood vessels. The yellow line and pink line illustrates the dose to the lungs and cardiac ventricles. Maximum spinal cord dose was 3 Gy (orange). The brown and dark line illustrates the dose to the right and left brachial plexus.
