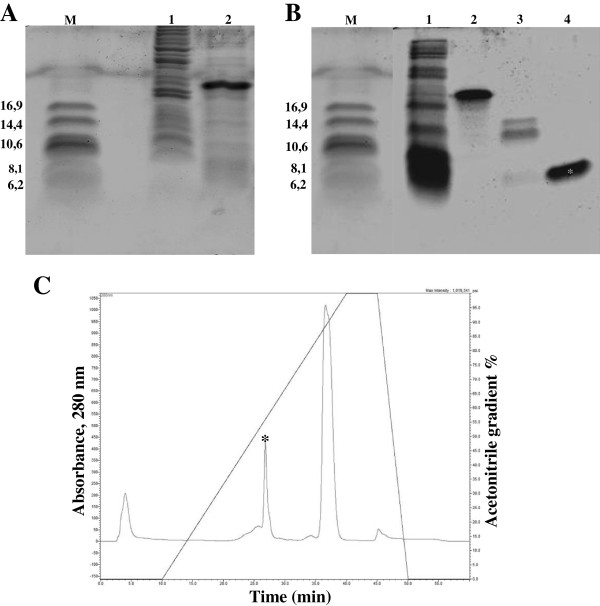
Figure 2.
SDS-tricine gel electrophoresis analysis of PvD1r expression and purification. (A) Lane 1, protein extract of the uninduced pET-PvD1 transformed Rosetta-gami 2 bacteria; lane 2, protein extract of the induced pET-PvD1 transformed Rosetta-gami 2 bacteria. (B) Lane 1, N1 peak obtained from Ni+ affinity chromatography; lane 2, N2 peak obtained from Ni+ affinity chromatography; lane 3, N2 peak after enterokinase cleavage; lane 4, Purified PvD1r obtained from the C2C18 reversed-phase column; M - low molecular mass marker (kDa). (C) Chromatogram of the last step of the purification of PvD1r after cleavage of N2 with enterokinase. The oblique line indicates the acetonitrile gradient. The retention time of PvD1r was previously determined by purified PvD1r in Ni+-NTA agarose. The same retention time was collected and this sample presented only one band by tricine gel electrophoresis (Figure 2B4). The peak and the corresponding band are indicated by asterisks.

