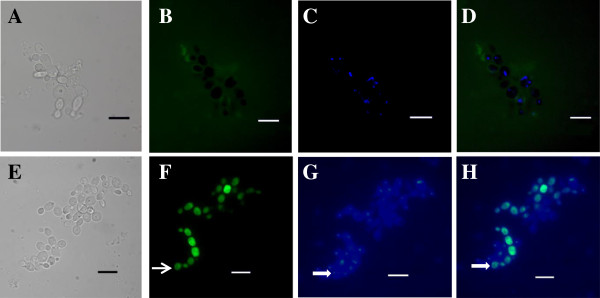
Figure 6.

Fluorescence microscopy of Candida albicans cells. (A-D) Mutant cells; (E-H) Wild-type cells. Cells were incubated for 24 h with 50 μg.ml -1 FITC-conjugated PvD1r (green fluorescence) (B and F). After the incubation period, the nuclei were stained with DAPI (blue fluorescence) (C and G). Light microscopy (A and E). Overlap of the DAPI and FITC images (D and H). The open arrow shows the FITC labeling (F); the filled arrows show the DAPI nuclei labeling (G) and the colocalization of FITC and DAPI (H). Bars = 10 μm.
