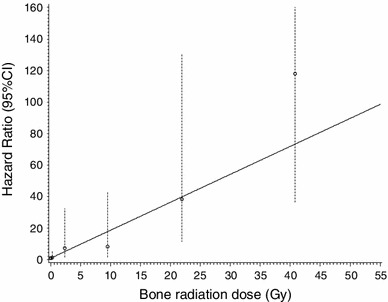
Fig. 3.

Hazard ratio for bone sarcoma according to the radiation dose to the bone; the circles represent observed values by radiation dose, and vertical bars represent corresponding 95 % CI. The curve is the prediction using the following model: HR = 1 + 1.773 * dose; 95 % CI for 1.773: 0.6213–5.935; six levels of dose represented are no radiation dose, 0–1, 1–5, 5–15, 15–30 Gy and more than 30 Gy. Note The upper-bound confidence limit of the last category of dose has been truncated for better readability
