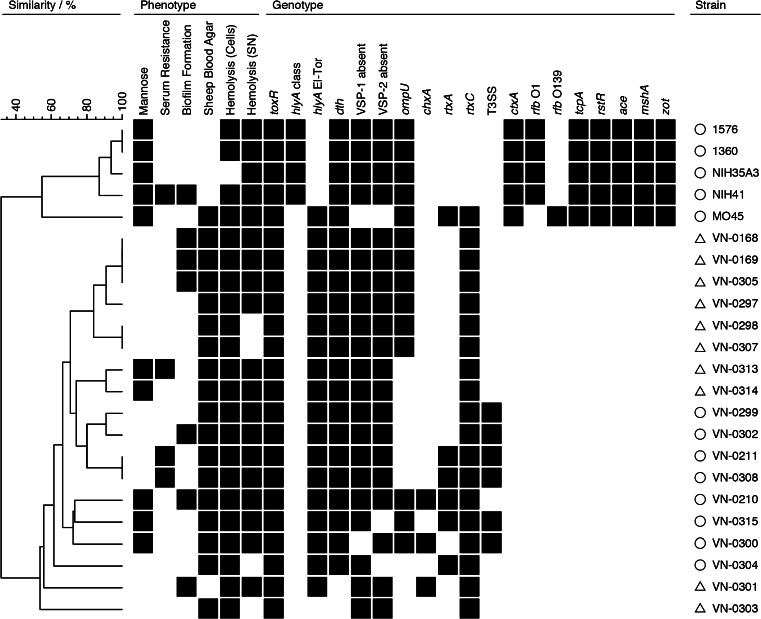
Fig. 2.
Grouping of isolates based on phenotypic and genotypic traits. Similarity patterns were determined by complete linkage using simple matching of binary data (BioNumerics version 6.6.4, Applied Maths, Sint-Martens-Latem, Belgium). For the simplification of interpretation, the results of tcpA (two alleles) and rstR (three alleles) are summarized in one column. О = diarrheagenic strains, Δ = strains from local infections

