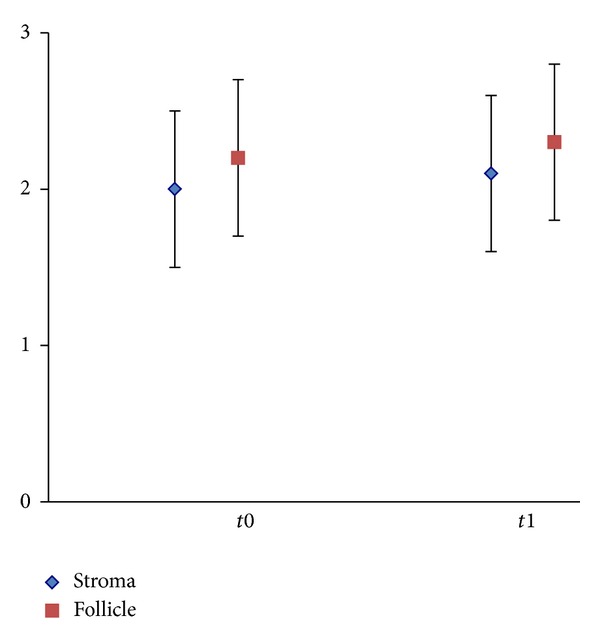
Figure 2.

Statistical analysis, showing scores for follicle and stroma preservation in fresh (t0) and vitrified/warmed (t1) ovarian cortical tissue. Values are expressed as mean ± SD. Score interpretation: 0 = good preservation, 1 = poor preservation, 2 = bad preservation, and 3 = worst preservation. P = 0.17 for stroma and P = 0.53 for follicles.
