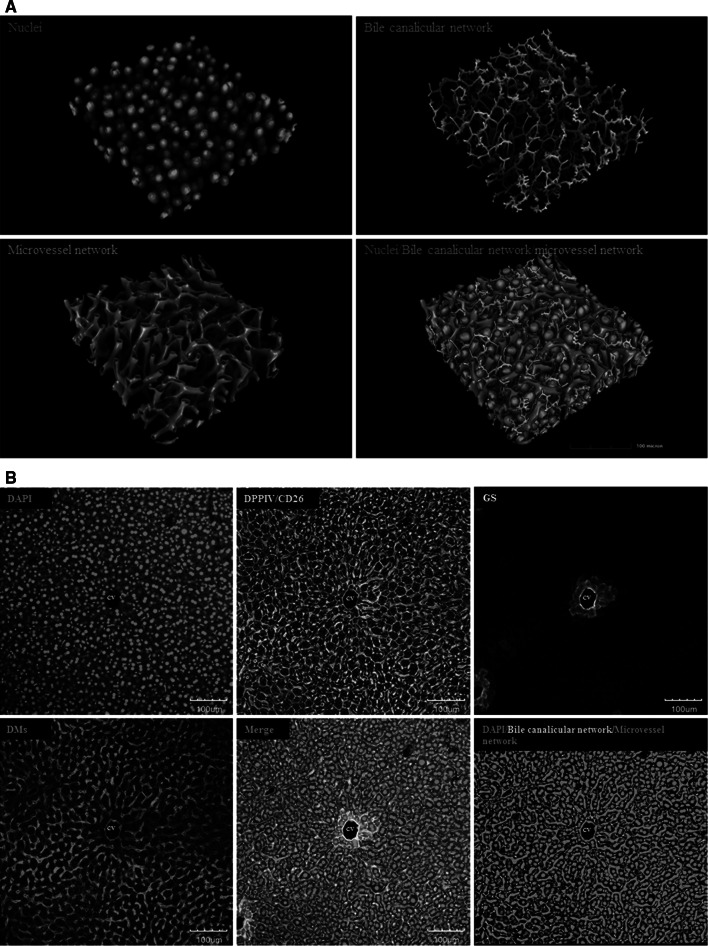
Fig. 2.
Liver architectural staining. a Examples of reconstructed mouse liver tissue. Blue nuclei, green: bile canalicular network and red: microvessel network. The scale bars are 100 μm. b Raw data obtained from a confocal laser scanning microscope. Only an individual slice level is shown. A routine z-stack of 75–100 μm includes approximately 180 such slice levels. Blue DAPI, green DPPIV/CD26, red DMs and white GS-positive hepatocytes. The scale bars are 100 μm. CV central vein, DMs donkey anti-mouse IgG, DAPI 4′,6-diamidino-2-phenylindole, DPPIV dipeptidyl peptidase IV, GS glutamine synthetase (colour figure online)

