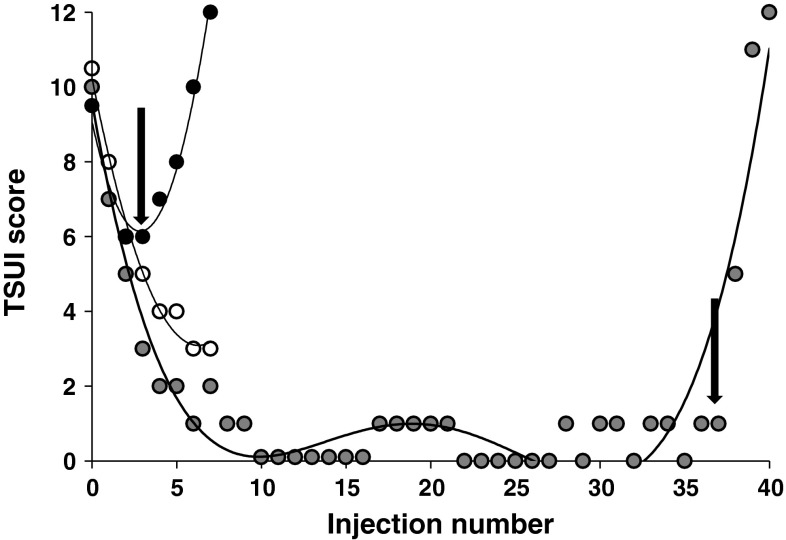
Fig. 1.
Comparison of the course of BoNT treatment in three patients with an initial TSUI score of 10. Patient 1 (open circle) showed continuous improvement over seven treatment cycles. Due to occupational reasons he ceased attending our clinic and his data were censored in the Kaplan–Meier analysis after seven injections. Patient 2 (dark circle) initially showed a good response which was reduced after the second injection (indicated by the arrow on the left). Patient 3 (gray circle) who had a better initial treatment response than patients 1 and 2 developed partial secondary treatment failure after 38 treatment cycles (indicated by the arrow on the right)

