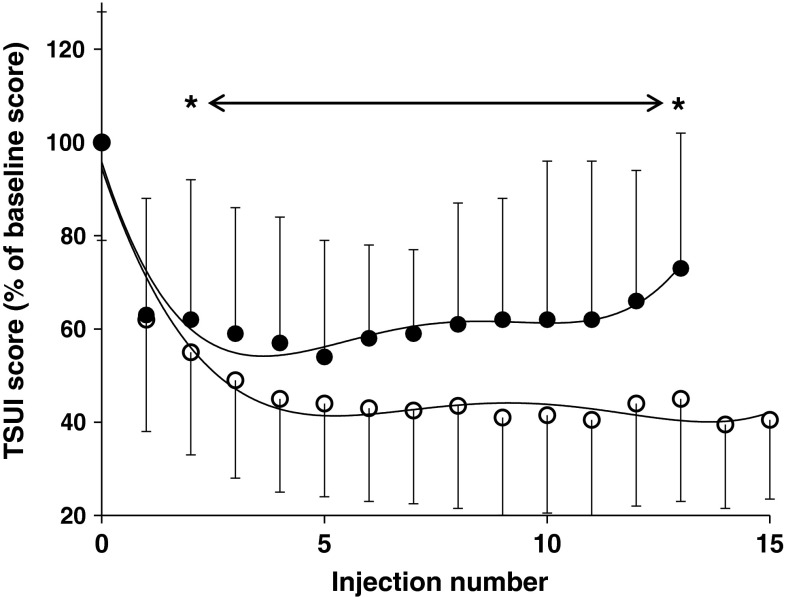
Fig. 3.
Comparison of standardized mean TSUI scores (± SD) in the PSTF subgroup (dark circle; n = 33) and the NSTF subgroup (open circle; n = 535) from the first injection onwards. The first injection had an equal effect in both subgroups. However, mean standardized TSUI scores improved significantly more in the NSTF subgroup than in the PSTF subgroup after the second BoNT/A injection (asterisk = p < 0.05). The number of patients decreased with number of injections (NSTF subgroup: baseline: N = 535; 5 inject.: N = 497; 10 inject.: N = 429; 15 inject.: N = 372; PSTF subgroup: baseline: N = 33; 5 inject.: N = 32; 10 inject.: N = 30; 15 inject.: N = 29)

