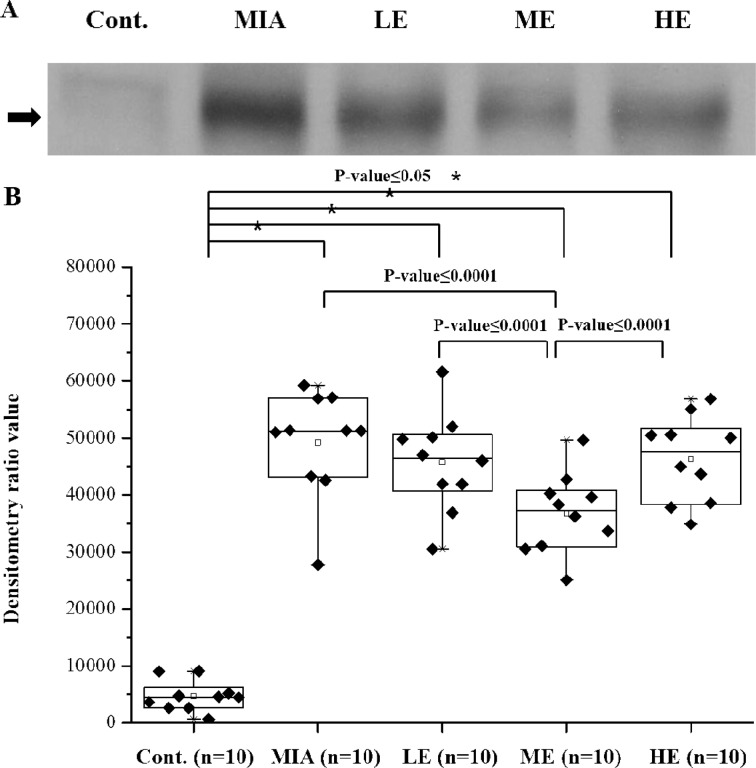
Fig. 1.
Validation of C9 by Western blot and densitometry analysis. (A) Representative Western blot of crude sera from each group. (B) The Western blot data of the crude sera of 10 individuals from each group were subjected to densitometry analysis. The density and area of the bands of the Western blot were measured by using Scion Image, as described in the Materials and methods.

