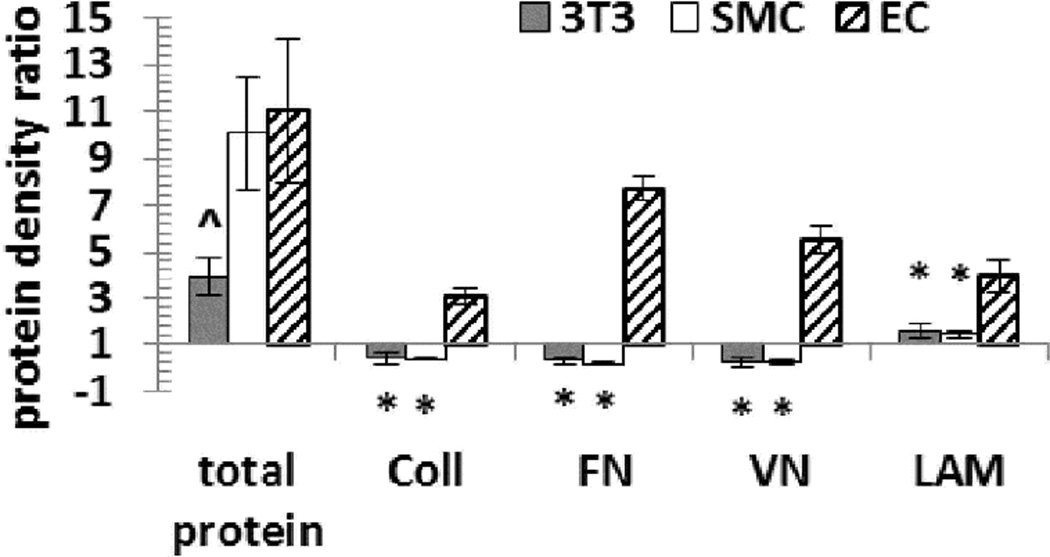
Figure 5.
Changes in density of adsorbed protein on a DM90- modified surface after 2 days of cell culture, relative to the density adsorbed from culture medium in the absence of cells. Y axis represents the ratio between protein density after 2 days of cell culture and protein density in the absence of cells. A ratio > 1 means increased surface protein density after cell culture. Total adsorbed protein was measured via a NanoOrange assay, while individual proteins (collagen = Coll; fibronectin = FN; vitronectin = VN; laminin = LAM) were measured via immunofluorescent staining. (*) p<0.0001, (^) p<0.002 compared to EC-cultured DM90 surface.

