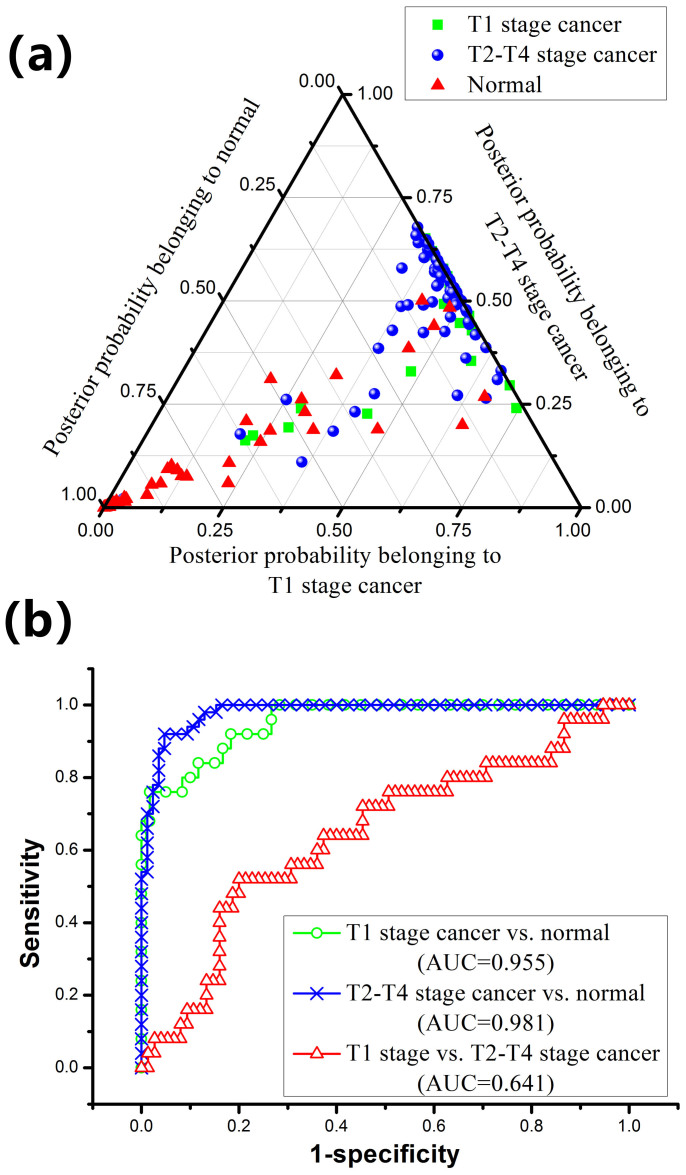
Figure 4.
(a) Two-dimensional ternary plot of the posterior probabilities belonging to normal, T1 stage cancer and T2–T4 stage cancer blood plasma samples, illustrating the good clustering of the three distinctive groups achieved by the PCA-LDA diagnostic algorithms. (b) Receiver operating characteristic (ROC) curves of classification results for different T stages of NPC generated from PCA-LDA analysis. The integration areas under the ROC curves (AUC) are 0.641, 0.955 and 0.981, respectively, for the three groups' classification.

