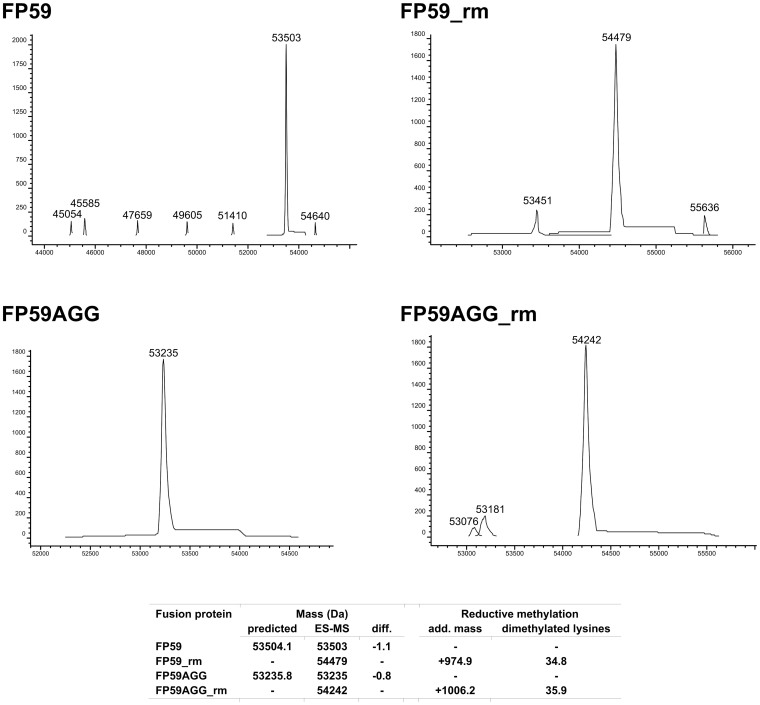
Figure 2. Mass spectrometry analyses of FP59 variants.
Electron spray ionization mass spectrometry analysis of FP59, FP59rm, FP59AGG, and FP59AGGrm. The graphs show the results of the deconvolution of the data obtained for each fusion proteins with the respective masses. The table summarizes the results and shows the predicted masses, differences to the observed results, additional masses for the dimethylated fusion proteins and the resulting number of dimethylated lysines.

