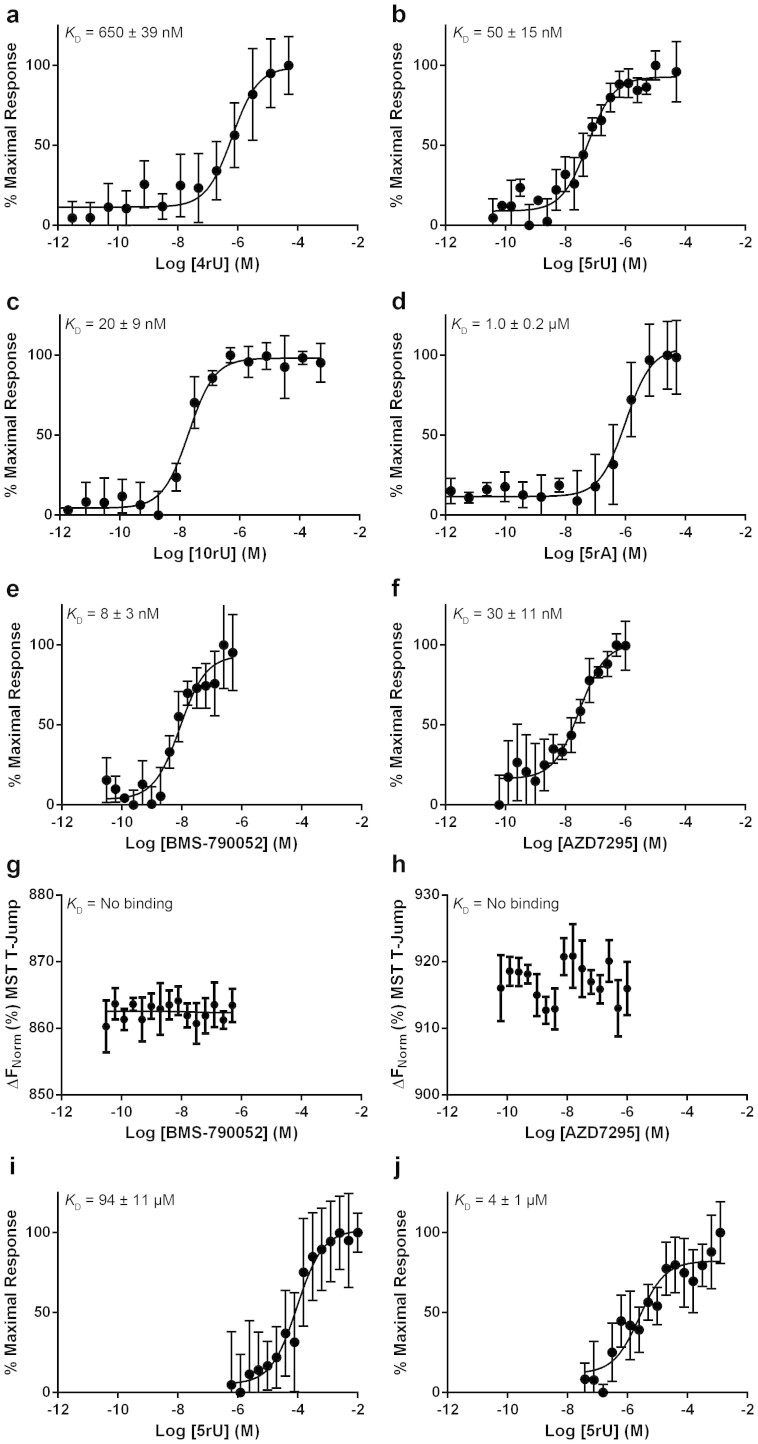
Figure 2. Binding to domain 1 NS5A33–202 genotype 1b (con1).
Binding of (a) 4rU, (b) 5rU, (c) 10rU, (d) 5rA, (e) BMS-790052, (f) AZD7295, (g) BMS-790052 in the presence of 5-fold excess 5rU, (h) AZD7295 in the presence of 5-fold excess 5rU, (i) 5rU in the presence of 0.25 μM BMS-790052, or (j) 5rU in the presence of 0.5 μM AZD7295 to NS5A33–202. Values on the Y-axis represent the percentage of the maximal thermophoretic response observed, or in the case of no detectable binding values on the Y-axis represent the thermophoretic shift of the labelled protein. All binding curves were determined in triplicate by MST and are represented as the mean ± SD.

