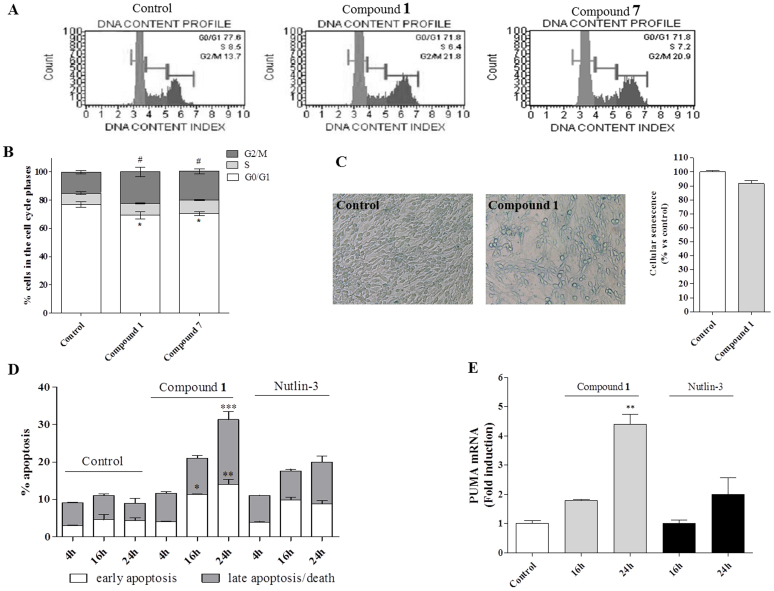
Figure 7. New synthesize compounds trigger checkpoint-dependent cell-cycle arrest and apoptosis in U87MG cells.
U87MG cells were treated with compounds (5 μM) or DMSO (control) for 24 h. After incubation time, tumor cells were employed for cell cycle analyses (panel A, B) and SA-β-Gal senescence marker (panel C). The cell cycle analyses was performed as describe in Methods. Representative cell cycle histograms of untreated and treated cells were shown (panel A). The data are presented as percentage of cell in the different phases (G0/G1, G2 or S) versus total cell number. Data represent the mean ± SEM of three different experiments. Statistical significance was determined with a one-way ANOVA with Bonferroni post-test: *P < 0.05 vs Control G0/G1 cells, #P < 0.05 vs Control G2 cells, §P < 0.05 vs Control S cells. (C) Representative images of SA-β-Gal-expressing cells: The panel shows the SA-β-Gal-expressing MDM2 inhibitor-treated and untreated cells at 24 h. (D) Evaluation of apoptotic cells: U87MG cells were treated with 5 μM Compound 1 or 10 μM Nutlin-3 for 4–16–24 h. After incubation time cells were collected and the phosphatydilserine externalization was evaluated using Annexin V protocol as describe in Methods. The data are expressed as percentage of apoptotic cells (Early-apoptotic in white, late-apoptotic/necrotic in grey) versus the total number of cells. Data represent the mean ± SEM of three different experiments. Statistical significance was determined with a one-way ANOVA with Bonferroni post-test: *P < 0.05, **P < 0.01, ***P < 0.001 vs Control. (E) Relative mRNA quantification of PUMA: U87MG cells were treated with Compound 1 or Nutlin-3 for 16–24 h. The relative mRNA quantification of PUMA was performed by real-time RT-PCR as describe in Methods. Data represent the mean ± SEM of three different experiments. Each experiment was performed in duplicate. Statistical significance was determined with a one-way ANOVA with Bonferroni post-test: **P < 0.01 vs Control.

