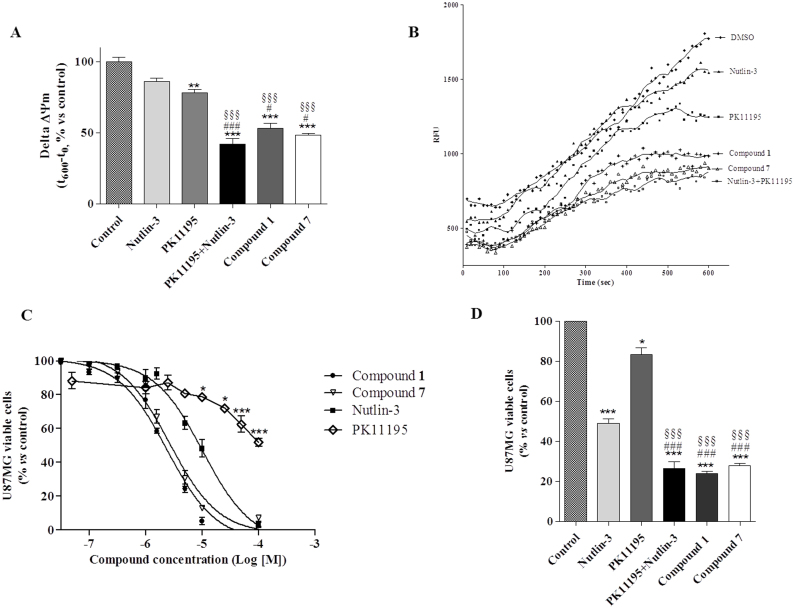
Figure 8. New synthesized compounds exert dissipation of Δψm and a dose dependent antitumoral effect intact U87MG cells.
(A) Evaluation of Δψm in U87MG cells: U87MG cells were treated for 24 h with 5 μM compound 1, or 5 μM compound 7, or 10 μM Nutlin-3, or 10 μM PK1195, or a combination of Nutlin-3 and PK11195. After incubation time, mitochondria were isolated and the Δψm (for 5 μg of proteins) was evaluated using JC-1 protocol as describe in Methods. The data are expressed as the variation of JC1 uptake into mitochondria, calculated as the difference between RFU at the beginning and those read after 10 minutes. Data represent the mean ± SEM of three different experiments. Each experiment was performed in duplicate. Statistical significance was determined with a one-way ANOVA with Bonferroni post-test: **P < 0.01, ***P < 0.001 vs Control; §§§P < 0.001 vs PK11195 alone; #P < 0.05, ###P < 0.001 vs Nutlin-3 alone. (B) Representative graph of mitochondria potential evaluation using JC-1 protocol. The results were expressed as RFU units in time. (C), (D) Evaluation of in vitro anti-proliferative effect: the U87MG cells were treated with increasing concentrations of the compound 1, 7, PK11195 or Nutlin-3, or PK11195 (10 μM) and Nutlin-3 (10 μM) in combination, and the viable cells were counted after 24 h of treatment by Trypan blue exclusion assay. The data were expresses as percentage of compound-treated viable cells respect to control viable cells. Curves were generated using a sigmoidal dose-response curve model (GraphPad Prism 4 software) from which the IC50 values were derived. Data represent the mean ± SEM of three different experiments. Each experiment was performed in duplicate. Statistical significance was determined with a one-way ANOVA with Bonferroni post-test: *P < 0.05, ***P < 0.001 vs Control; §§§P < 0.001 vs PK11195 alone; ###P < 0.001 vs Nultlin-3 alone.

