
Figure 2.
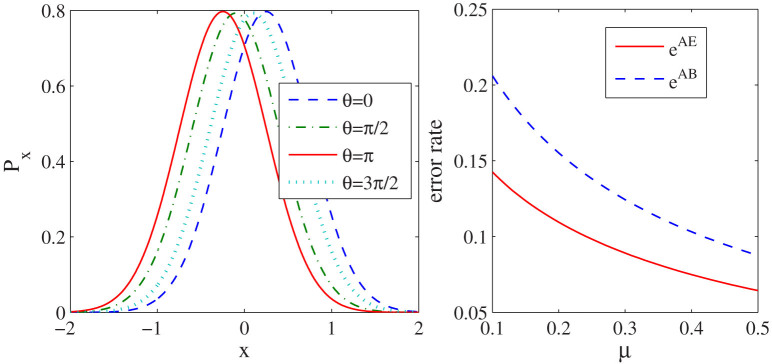
(a)The theoretical distribution of x for different encoding phase of Alice, which are drawn according to Eq.4. Here we assume ϕe = 0, δ = π/4 and μ = 0.3. (b) The error rate of Eve and Bob under our attack, which are drawn according to Eq.7. The solid line shows the error rate between Alice and Eve, and the dashed line shows the error rate between Alice and Bob. Here we set δ = 10°, x0 = 1.5, and assume that the detection setups of both Alice and Bob are perfect.