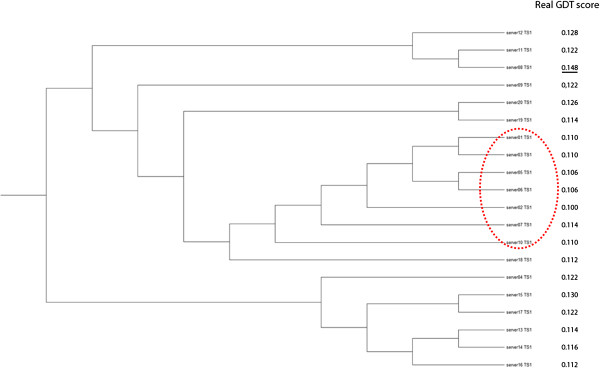
Figure 3.

The hierarchy tree of T0741 on Stage 1. All models in the circle form the largest cluster in this target. The rightmost column of Figure 3 lists the real GDT-TS score of each model. The models in the circle form the largest cluster. The model with the underline real GDT-TS score is the best model in this target.
