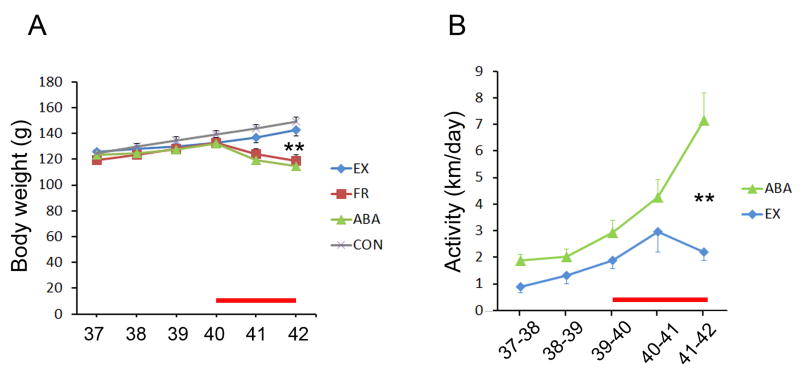
Figure 3. Body weight and exercise of ABA animals, relative to age-matched controls.
Panel A. The body weight was measured daily and compared for the 8 ABA, 7 EX, 8 FR, and 8 CON animals. Panel B. The daily activity of 8 ABA and 7 EX animals was measured as the distance run on the wheel. Animals were acclimated to the wheel starting the age of postnatal day 37. The red line along the x-axis in panels A and B indicate the dates of food restriction for the ABA and FR groups. For both graphs, the values represent mean ± SEM. ** indicates p<0.001, comparing ABA to CON in panel A and ABA to EX in panel B.

