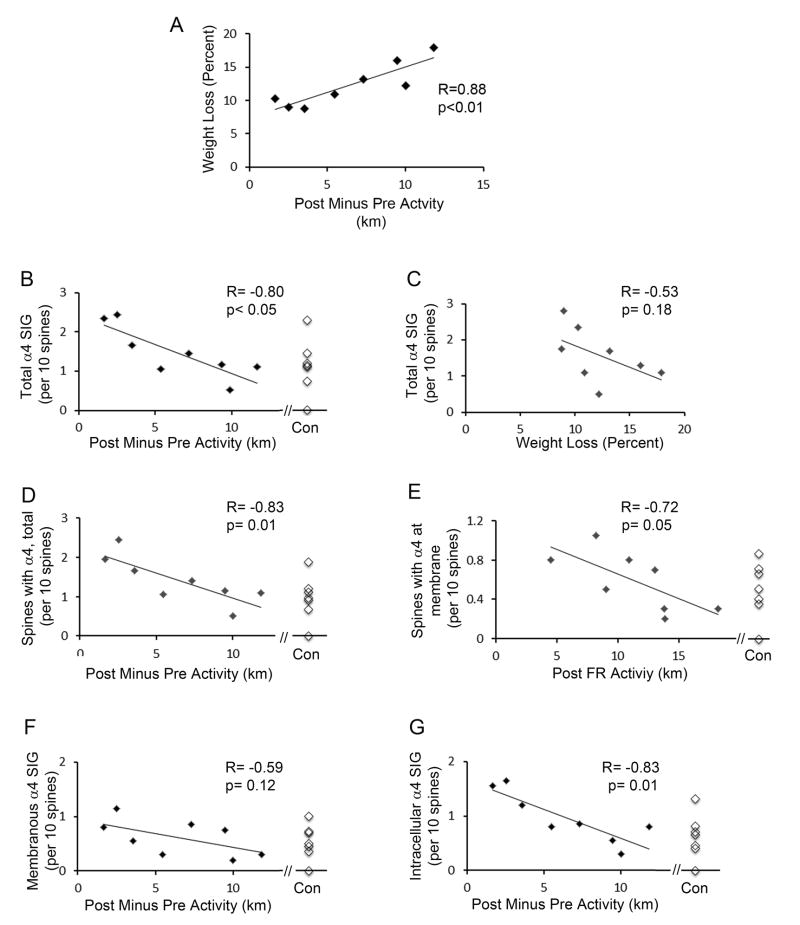
Figure 4. α4-immunoreactivity in the hippocampus of ABA animals at P42 is negatively correlated to wheel-activity.
The food restriction-evoked increase in wheel activity was quantified as the distance run during the 2 days after food restriction began minus the distance run during the 2 days preceding food restriction. All animals exercised more after food restriction. Panel A. The extent of increase in activity after food restriction correlates strongly with the body weight lost following food restriction. Each data point in Panel A and all other panels represent the values of one animal’s food restriction-evoked hyperactivity during the 2 days of food restriction, correlated with the percent of body weight lost during the same 2 days. Panel B. α4-immunoreactivity within spines was quantified by counting all silver-intensified immunogold particles (SIG) that occur along the extracellular surface of the plasma membrane and intracellularly (i.e., Total count) for every group of 10 spines encountered. Repeated measures of this SIG count per 10 spines correlates negatively with the hyperactivity that is evoked by food restriction. Each point represents data from one animal. Here and in other panels, α4 immunoreactivity of tissue from 7 CON animals are shown for comparison with the values of ABA animals. Panel C. Total SIG count correlates less strongly with the percent of weight lost during the 2 days of food restriction. Panel D. The proportion of spines exhibiting α4-immunoreactivity for every group of 10 spines encountered also correlates strongly with the hyperactivity evoked by food restriction. Panel E: The counts of SIG particles that occur specifically at the extracellular surface of spines’ plasma membranes correlates with the total level of activity during the 2 days that follows food restriction. Panel F. SIG at the spine membrane correlates only weakly with the extent of hyperactivity after food restriction. Panel G. SIG levels that reside in the cytoplasm correlate very strongly with the food restriction-evoked hyperactivity.

