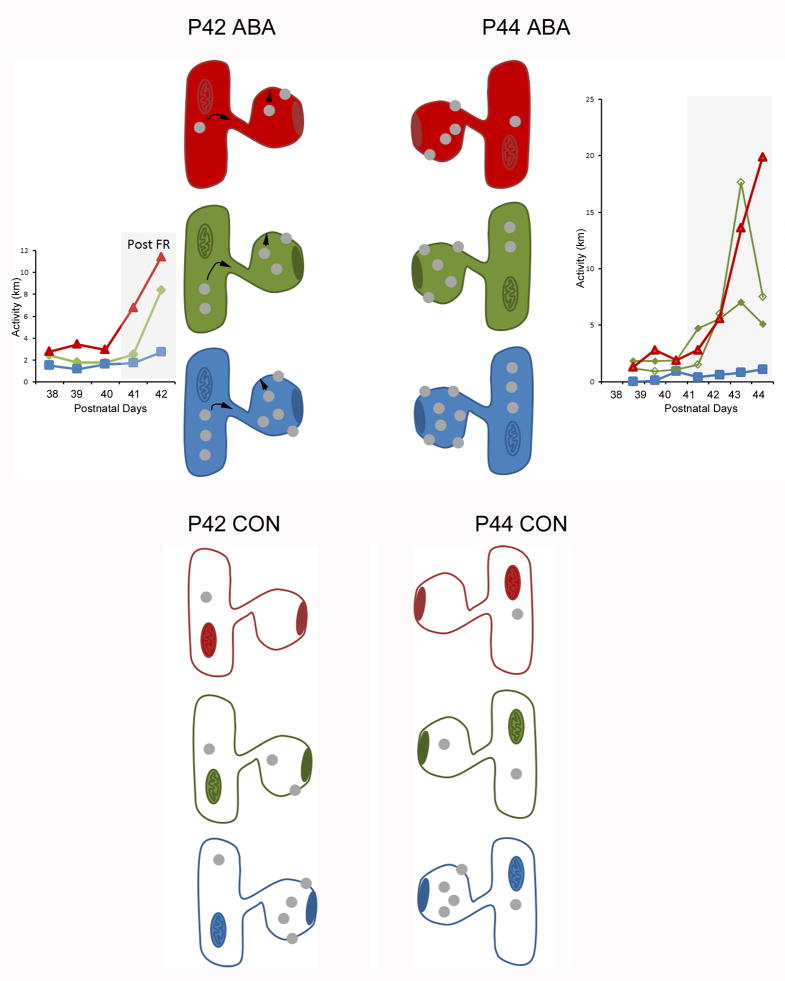
Figure 5. Summary of results.
This schematic summarizes the α4-immunoreactivity levels observed at the plasma membrane and intracellularly within dendritic spines of the CA1 pyramidal cells across two stages of ABA induction, P42 and P44. The spine head shows a PSD, where excitatory axons target. The shafts to which the spines are connected are depicted by the presence of a mitochondrion.
The pattern of immunoreactivity correlated negatively with the animal’s activity on the wheel. The spines filled with red, green and blue colors depict the α4-immunoreactivity observed within brains of animals that exhibited the greatest (red lines in graphs), intermediate (green lines in graphs) and lowest (blue lines in graphs) activity on the wheel, respectively, following ABA induction. Each grey dot represents the level roughly equal to 0.5 SIG particle per 10 spines. The activities (in km per day) are actual values recorded from 6 representative animals. ABA induced de novo synthesis of α4 subunits but the increased expression among the P42 group was not yet statistically significantly different from those of CON animals (depicted with a colorless cytoplasm) that never received food restriction or the wheel access. α4-immunoreactivity within spines of the P42 dendrites is in flux, as is indicated by the black arrows. By P44, following four days of food restriction, there was a significant increase in the level of α4, relative to age-matched controls. Based on the consistent correlation between activity and α4-immunoreactivity, it is likely that those individuals that exhibited the least activity (the Blue group) already expressed higher levels of α4 before ABA induction and were able to respond to food restriction with the greatest increase in α4 expression. The response in α4-immunoreactivity was more rapid for the intracellular domain than for the membrane domain. This spatio-temporal pattern is depicted by individual differences within the cytoplasmic domain at P42, followed by an increase in the membranous domain by P44.

