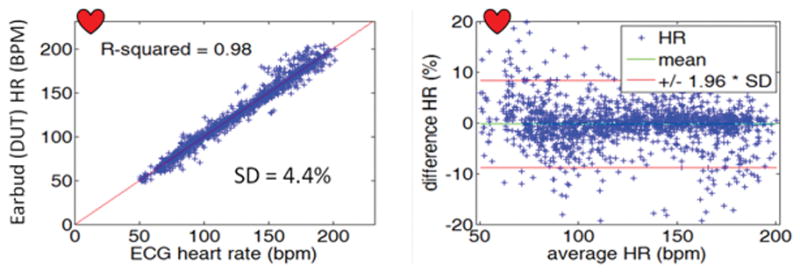
Figure 3. Heart Rate using the Earbud (DUT) and the simultaneously measured ECG benchmark.

a) Regression relation comparing estimated (Earbud) vs. measured (ECG) heart rate for all data points collected for each participant and b) Bland-Altman plot of same. All the data points were taken from the training data collected during the Duke CPX test. The mean difference (bias) was −0.2% and the standard deviation was 4.4%. The mean is shown by the green line, and the 1.96 SD (95% limits of agreement) boundaries are shown by the red lines.
