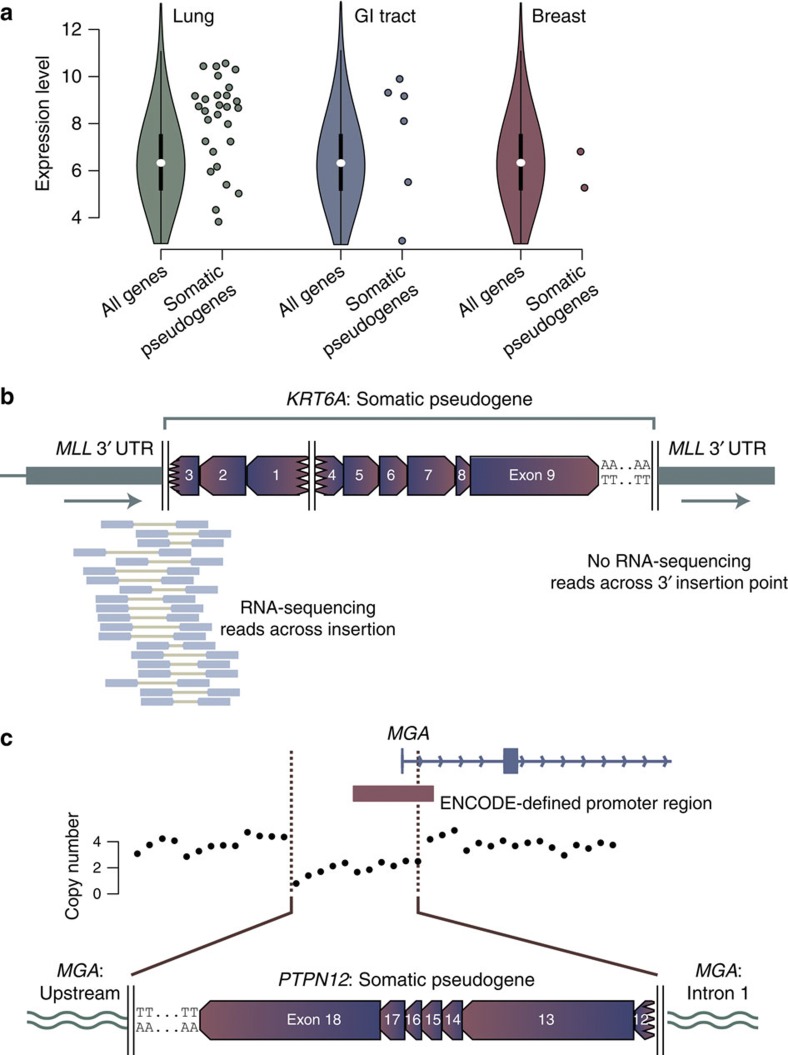
Figure 3. Tissue-specific patterns of somatic pseudogenes.
(a) Expression of template genes for somatic pseudogenes (individual points) compared with all genes for the most frequently affected organ sites. The violin plot formulation for all genes shows the median (white point), interquartile range (thick black line) and 1.5 × the interquartile range (thin black line). The coloured shapes denote a kernel density plot of the distribution of gene expression levels for all genes. Due to the non-normal distribution, we used Wilcoxon rank-sum tests to test whether expression levels of template genes for somatic pseudogenes were different to that expected. (b) RNA-sequencing data showing expression of the MLL-KRT6A fusion gene. (c) Deletion of the promoter and first exon of MGA during somatic pseudogene insertion, leading to abrogation of expression from that allele.

