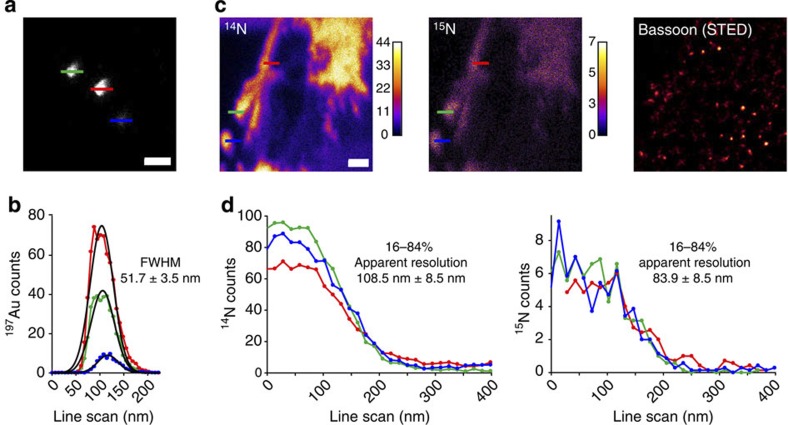
Figure 1. The lateral resolution of SIMS imaging in neuronal samples.
(a) As a proof-of-principle experiment, upper surfaces of 100 nm gold particles embedded in gelatin were scanned by SIMS. Three particles are indicated. Scale bar, 200 nm. (b) The line scans from panel a are plotted. Gaussian fits to the line scans provide a full-width-at-half-maximum of ~50 nm. The use of a different definition for the image resolution, the signal drop from 84 to 16% of the maximum (which has been frequently used for SIMS6,24) indicates an even higher resolution, of ~33 nm. (c) SIMS analysis: 14N and 15N images from an axonal area. A STED image of this area shows the immunolabelling for the active zone marker protein bassoon. The STED image was processed with deconvolution. Scale bar, 500 nm. (d) Line scans were performed on the SIMS images from panel c, in the areas indicated by the coloured bars. The resolution, calculated using the 16–84% criterion, is shown as an average of the three line scans±s.d.

