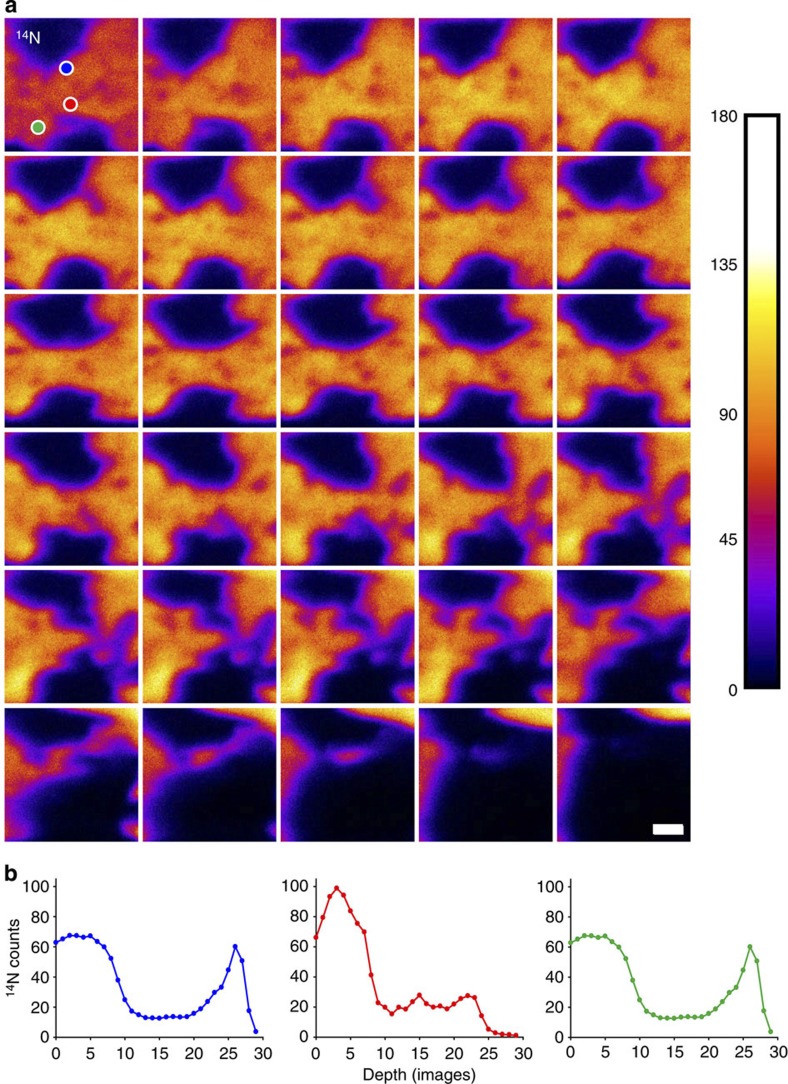
Figure 2. The depth resolution of SIMS imaging in neuronal samples.
(a) SIMS images were collected repeatedly in one neuronal area. The sample is slowly eroded, which allows the production of images from progressively deeper layers. A Z-stack of the sample is obtained. For simplicity, only the 14N images are shown. The 200-nm-thick sample was eroded over 35 images, which indicates that, on average, a sample layer of 5.7 nm is eroded for each image. Scale bar, 500 nm. (b) We analysed the signal changes in three areas, indicated by the coloured circles in the first image in panel a (for clarity, the circles are omitted in the following images). Circular regions of interest were used, with a diameter of 152 nm (20 pixels). The signal intensity for each of the three regions of interest (ROI) is shown (averaged for all pixels in each circular regions of interest). Signal changes occur over 2–4 SIMS images. Therefore, according to the 16–84% criterion, the depth resolution is (at most) 11.4–23 nm (as individual images correspond to a depth of 5.7 nm, as indicated above).

