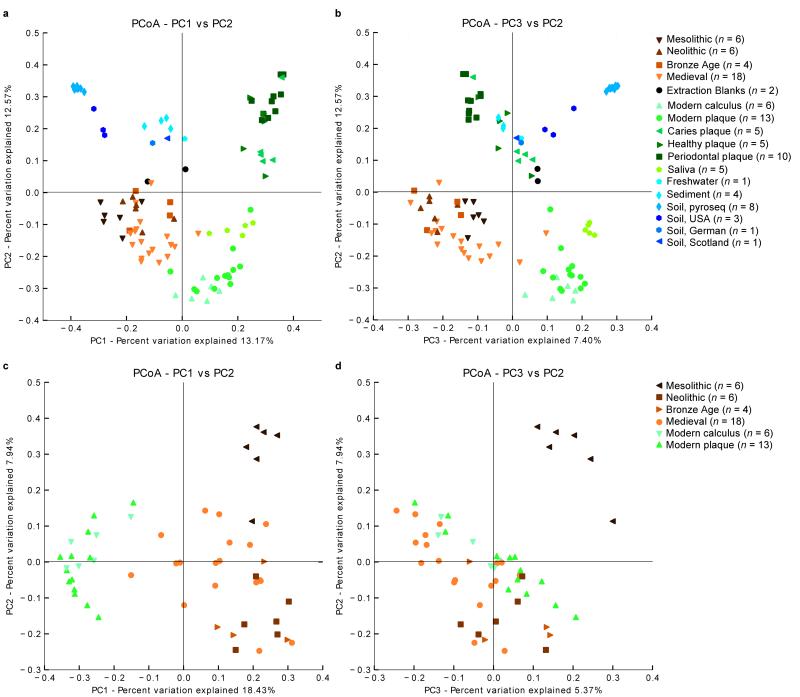
Figure 2. Principal components plot of β-diversity.
PCoA reveals a close phylogenetic relationship between ancient dental calculus and modern oral samples, both of which are distinct from the non-template controls and environmental samples. β-diversity was calculated for all samples (Supplementary Note) using the UniFrac metric for the V3 region, and PCoA was applied to the unweighted, UniFrac distances. The plot of the first and second components (PC1 and PC2) (a) and the first and third components (PC1 and PC3) (b) of the PCoA clustered the ancient dental calculus samples with the modern oral pyrosequenced data (calculus, plaque and saliva), which were separated from the environmental samples and extraction blanks. A restricted PCoA plot of PC1 and PC2 (c) and PC1 and PC3 (d) that only includes ancient and modern oral pyrosequencing samples separated the hunter-gatherer (Mesolithic) individuals from modern, Medieval, and Neolithic samples.

