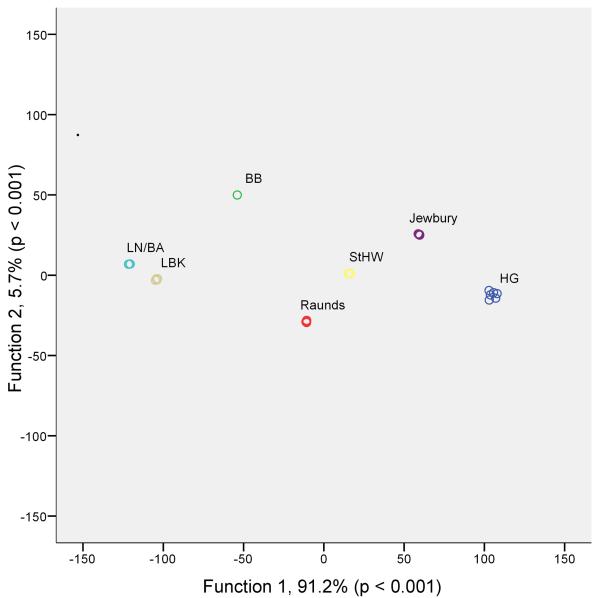
Figure 4. Discriminant analysis of β-diversity.
Discriminant analysis was applied to the principal coordinates generated from the unweighted UniFrac distances calculated from the V3 region sequences. Each individual is represented by a circle and coloured according to archaeological grouping (HG; Hunter-Gatherer, LBK; Linear Pottery Culture, BB; Bell Beaker, LN/BA; Late Neolithic/Bronze Age, StHW; St. Helen-on-the-Walls). The majority of phylogenetic variation (91.2%) was described by the first discriminant function, showing that individuals from the same archaeological groups cluster according to microbial composition

