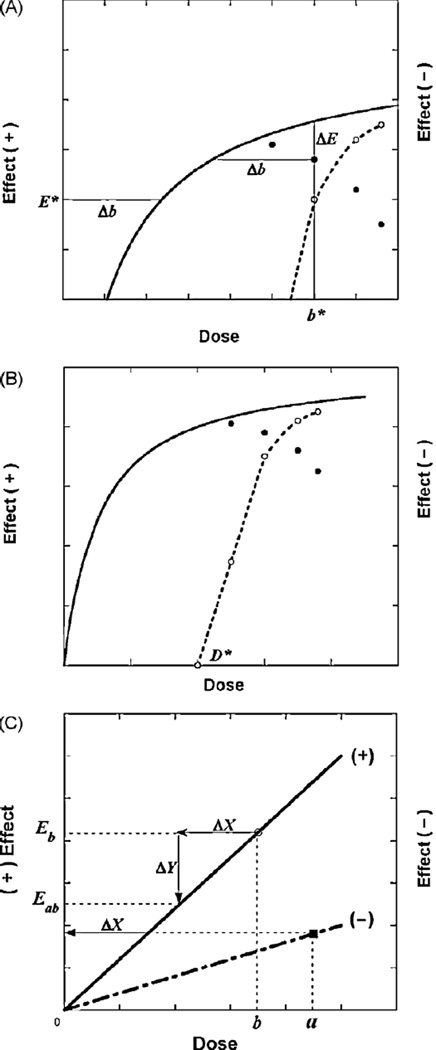
Fig. 1.
(A) Illustration. A representative drop from the smooth curve (solid line), denoted ΔE, is equivalent to a decrease in agonist dose = Δb, a dose value on the smooth curve at effect E* and, therefore, locates the point (b*, E*) for the (decreasing) second component of action (dotted line). (B) Illustration. A dose–effect curve (solid line) for doses up to dose D* ismonotone increasing, whereas for doses greater than D* the effect decreases due to a second component of action. The dotted line, whose effect magnitudes are indicated on the right ordinate scale, represents decreasing effects for doses above D* due to the second component of the drug’s action. The combination of the decreasing and increasing components of action would yield the observed inverted-U values. (C) Illustration of two drugs that exert opposite effects. The upper line is an illustration of the dose–effect curve (not necessarily linear) of a drug whose effect is in a positive direction, whereas the lower line represents a drug that produces the opposite effect. The latter is plotted on the same coordinate system and, thus, its ordinate position denotes the magnitude of the negative effect.

