
Figure 5.
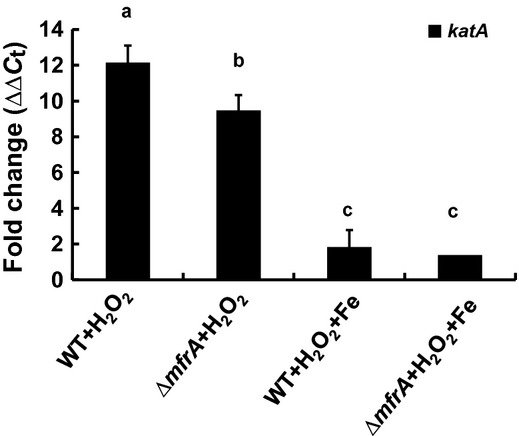
Quantification of the expression of katA in Campylobacter jejuni before and after exposure to H2O2 and iron. Expression of rpoA was used as a control and the difference in expression was calculated using the ΔΔCt method. The experiment was repeated twice and all samples were tested in triplicate. Statistically significant (P < 0.05) differences are highlighted with different letters. For example, a bar that is highlighted by the letter “a” is significantly different than those highlighted by “b” and “c,” while the same letter indicates comparisons that were not statistically significant. Data are presented as mean ± standard deviation.