Figure 4.

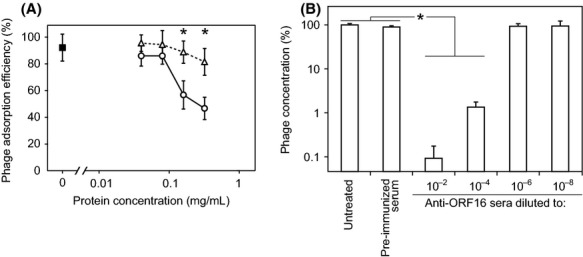
Role of ORF16 in phage S24-1 adsorption. The means and standard deviations are shown in the graphs (n = 6). The asterisks in the graphs indicate statistically significant differences (P < 0.01). (A) Phage-adsorption interference assay using rORF16. The white triangles and circles indicate the phage-adsorption efficiencies in the presence of BSA and ORF16, respectively. The black box indicates the phage-adsorption efficiency without any protein supplements (control). The phage-adsorption efficiencies were compared for the BSA and rORF16 treatments at the same protein concentrations. (B) Phage-adsorption interference assay using anti-ORF16 rabbit serum. The phage concentration was measured after incubation with diluted anti-ORF16 rabbit sera or preimmunized rabbit serum (30 min, 37°C). The untreated phage concentration was set at 100%.
