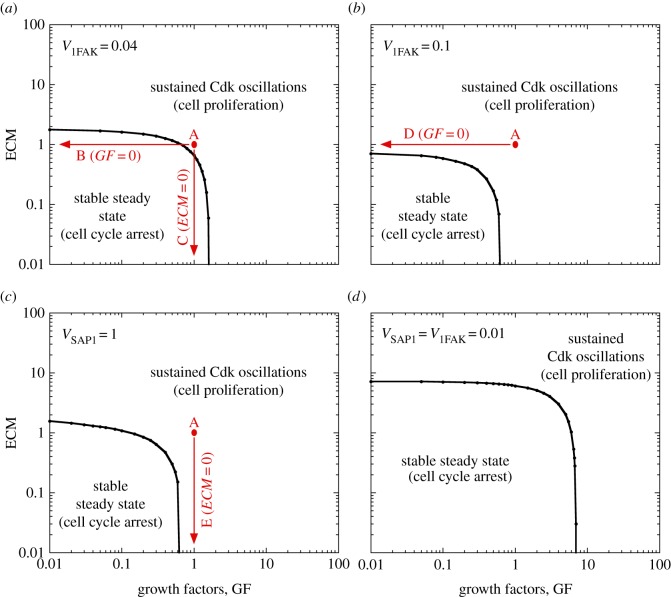
Figure 5.
Balance between cell cycle arrest and cell proliferation as regulated by ECM and GF. Dynamical behaviour of the Cdk network driving progression in the mammalian cell cycle is shown in the parameter plane defined by ECM and GF. (a) V1FAK = 0.04, which corresponds to the situation in figure 4a–c. (b) V1FAK = 0.1, which corresponds to the conditions of figure 4d with GF = 0. (c) VSAP1 = 1, which matches the conditions of figure 4e with ECM = 0. (d) Low levels of V1FAK and VSAP1 are considered: V1FAK = VSAP1 = 0.01. This reduction in the rates of activation of AP1 and FAK considerably extends the domain of cell cycle arrest. Dots and arrows in red correspond to the different situations illustrated in figure 4a–e. Other parameter values are as in figure 4. (Online version in colour.)

