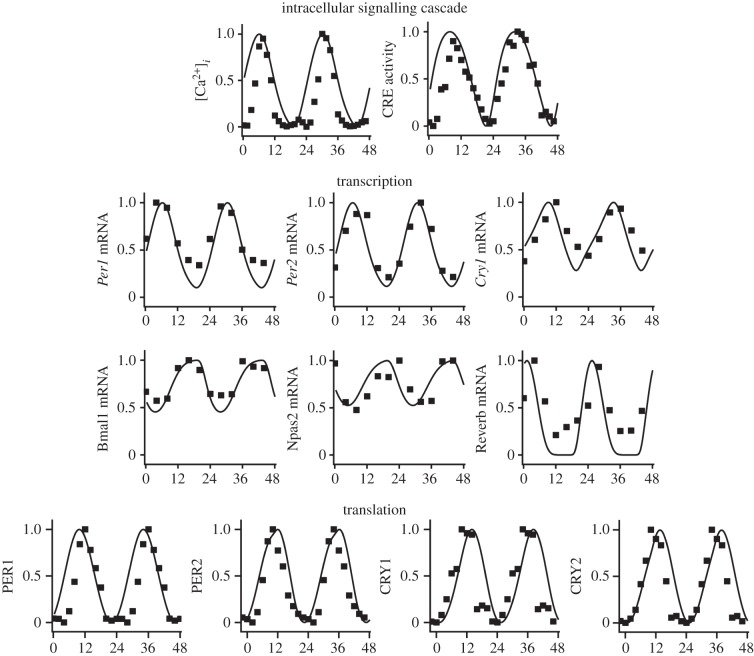
Figure 6.
Fits of the extended single-cell model to mRNA, protein, CRE activity and Ca2+ time series. Model predictions are shown as smooth curves, and experimental data as squares. All time series are normalized by their maximum values. mRNA and protein time series are the same as used in [16]. CRE and Ca2+ time series extracted from videos in [59].

