
Figure 7.
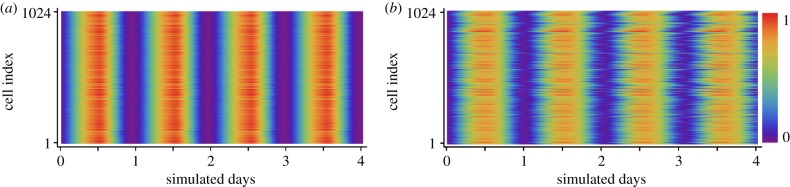
PER2 rhythms in the simulated SCN. (a) Raster plots of 200 cells selected randomly from the 1024 cells in the simulated SCN. Each row of the raster plot shows the total PER2 protein level versus time for one cell. Cells are all well synchronized throughout the simulation. (b) Raster plots from a simulation of uncoupled cells show that without VIP signalling, neurons drift out of phase as time progresses due to differences in intrinsic period. PER2 levels are normalized within each panel and displayed according to the colour scheme at the right. Cells are indexed from top to bottom in random order.