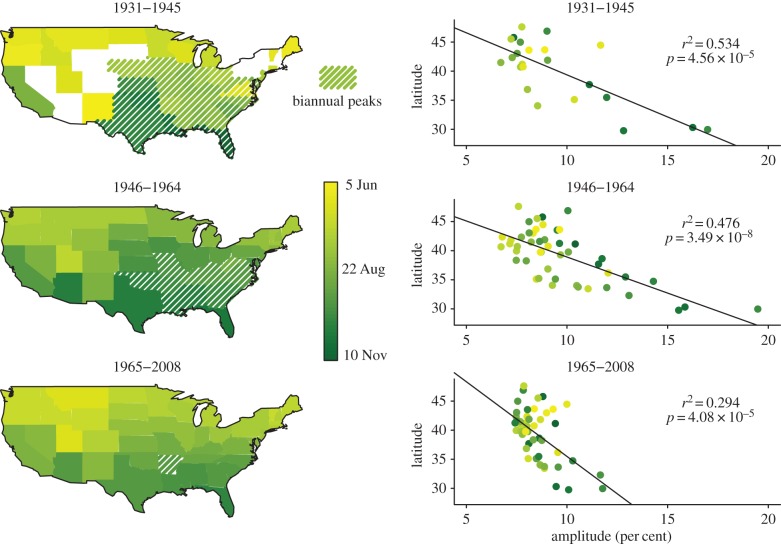
Figure 2.
Spatio-temporal patterns of seasonal birth peak timing and amplitude in the USA. (Top panels) Pre-Baby Boom (1931–1945), (middle panels) Baby Boom (1946–1964) and (bottom panels) Modern Era (1965–2008). Maps depict the latitudinal gradient in the timing of the birth peak. Colours indicate the mean timing of the birth peak for each state. Hatched regions represent states which had significant biannual peaks and are colour-coded based on the timing of their primary annual birth pulse (also see the electronic supplementary material, figures S1 and S2). States shown in white did not exhibit significant periodicity. Regressions show the latitudinal variation in seasonal amplitude, with the colours representing the peak birth timing for the respective period. (Online version in colour.)

