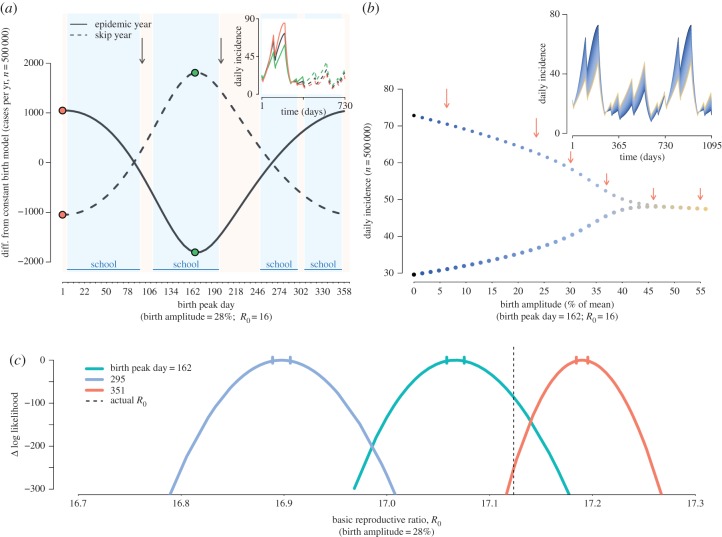
Figure 4.
Impact of birth seasonality on childhood disease. (a) Epidemic and skip-year incidence varies with birth peak timing along the x-axis. Solid curve shows the change in epidemic year incidence when birth seasonality is added to the measles model. Dashed curve shows the change in the skip-year. The phase relationship between seasonal births and transmission determines whether birth seasonality has an effect on incidence. The greatest increase in epidemic year incidence is when the birth peak occurs after children return from winter holiday (orange points). A decrease in epidemic year incidence occurs when births peak prior to summer vacation (green points). School terms are noted and vertical arrows mark the timing of incidence peaks during the epidemic year. (inset) Time series from the constant birth model (black), and time series corresponding to the colour-matched points on the main graph. (b) Bifurcation diagram showing the change in epidemic and skip-year peak incidence with increasing birth amplitude. In the absence of birth seasonality, epidemics are biennial. As birth amplitude increases, skip-year incidence increases and epidemic year incidence decreases. When birth amplitude reaches approximately 40% epidemics become annual. Time series in the inset correspond to the points in the main graph; blue time series are biennial, and golden are annual. Arrows denote the birth amplitude observed in Switzerland, Cuba, Egypt, Nigeria, Guinea and Sierra Leone, left to right. Amplitudes for Nigeria, Guinea and Sierra Leone are from reference [49]. (c) Bias in R0 estimates owing to the exclusion of birth seasonality in an SEIR model. Time series were generated using an SEIR model with 28% birth amplitude and a birth peak day of 162 (turquoise), 295 (blue) or 351 (orange). Each time series was fit to the SEIR model with a birth amplitude of 0%. The actual R0 value is shown by the dashed line, and the likelihood profiles show that maximum-likelihood estimate (MLE) of R0 is either over- or underestimated when birth seasonality is excluded from the model. 95% confidence intervals for MLE are indicated on profiles. (Online version in colour.)

