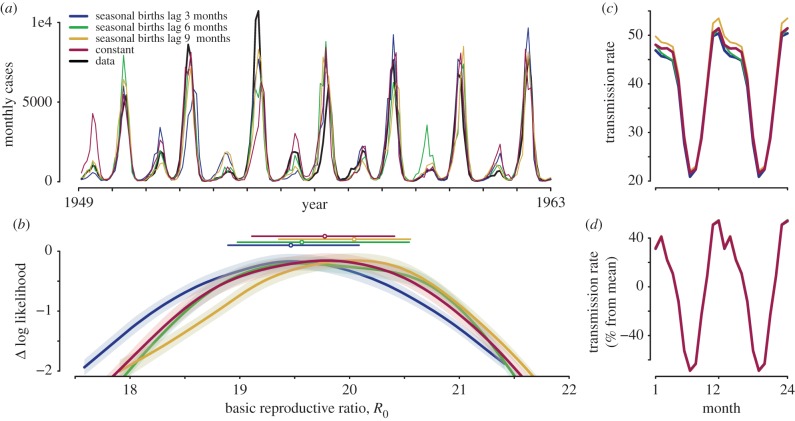
Figure 5.
Measles cases in New York City. (a) Measles incidence (black) and a stochastic realization using the MLE for each type of birth covariate: seasonal births with a three month lag (blue), seasonal births with a six month lag (green), seasonal births with a nine month lag (yellow) and births with no seasonality (maroon). Legend applies to all of figure 5. (b) The shape of the likelihood surface with respect to R0. The MLE R0s are indicated by points, and the values within the standard error of the MLE are represented by horizontal lines. (c) MLE transmission splines for each model. (d) Transmission splines estimated using TSIR [46,47] for each type of birth covariate. The MLEs differed with and without birth seasonality, but the differences in the point estimates were overwhelmed by uncertainty in parameter estimates (b,c). No difference in transmission parameters was observed using the TSIR method. (Online version in colour.)

