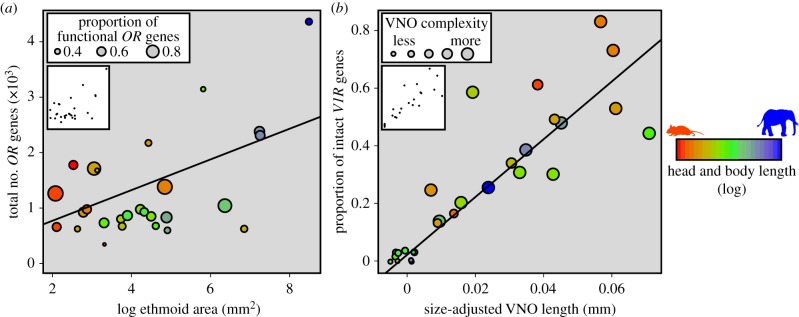
Figure 2.

Relationships among selected VNS and MOS variables. Panel (a) shows the total number of OR genes on the y-axis and absolute ethmoid area on the x-axis. The size of each point reflects the proportion of functional OR genes, which is not significantly related to ethmoid area. The colour of each point indicates the overall size of each particular mammal (log head and body length). Panel (b) shows size-adjusted VNO length on the x-axis and the proportion of intact V1R genes on the y-axis. The size of each point reflects the morphological complexity of the VNO, which is also positively correlated with both size-adjusted VNO length and the proportion of intact V1R genes. The colour of each point indicates the overall size of each particular mammal (log head and body length). Superimposed points were ‘jittered’ for visualization purposes; inset plots show points in their original position. Scatterplots of all comparisons appear in electronic supplementary material, figures S1–S3 and all regression statistics appear in electronic supplementary material, table S2.
