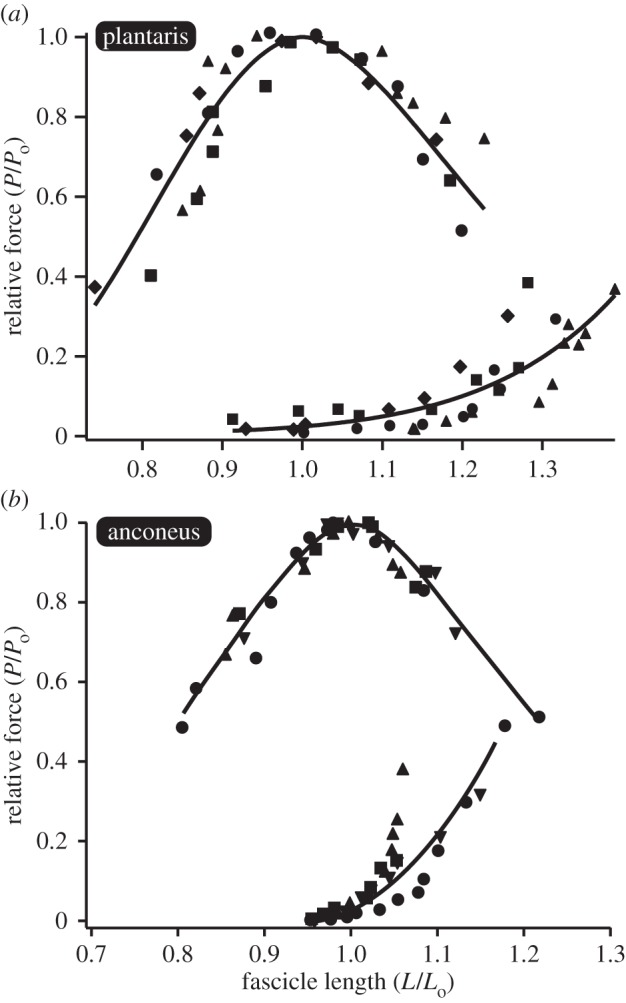
Figure 4.

Passive and active force–length curves for the (a) plantaris and (b) anconeus muscles. The same muscles with the same sonomicrometry transducers used for in vivo measurements are used to characterize the force–length curve in vitro. Data are normalized relative to the muscles maximum isometric force (Po) and the muscle's optimal length (Lo) and fit according to [21]. Each individual is shown with a different symbol.
