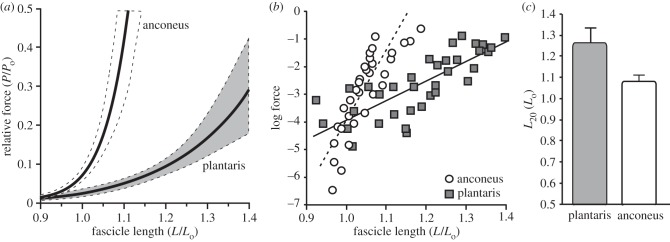
Figure 5.

A comparison of the passive properties of the plantaris and anconeus. (a) The passive force–length curves of the two muscles plotted with 95% confidence intervals of the curve (dotted). (b) Log-transformed passive forces. Log transformation converts data from an exponential curve to linear and allows for more direct statistical comparisons using an ANCOVA. Data from the two muscles differ significantly in their slope, suggesting that the two muscles vary in their stiffness (p = 0.0001). (c) A comparison of the lengths at which passive force develops in the two muscles. L20 represents the lengths at which passive force reaches 20% of maximum isomeric force (Po). L20 is significantly longer in the plantaris when compared with the anconeus muscle (p < 0.0001).
