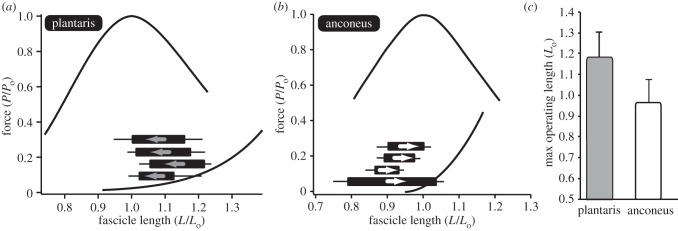
Figure 6.

The operating lengths of the (a) plantaris and (b) anconeus muscle. The operating length of each muscle is plotted onto the force–length curve. Each individual is shown as a single bar with the initial and final lengths defining the two ends of the bar. Each bar is shown alongside the standard error of the mean. For the plantaris, the muscle starts at a long length and shortens to the plateau. However, for the anconeus the muscle starts at a short length and lengthens on to the plateau of the force–length curve. Note that the bars only indicate the length range during hopping and do not correspond to the force axis. (c) The maximum operating length of the two muscles differs significantly (p = 0.003). The anconeus muscle is restricted to the ascending limb and plateau of the force–length curve, rarely operating at lengths above Lo.
